Allo and PiHole

I recently upgrade my Allo wireless to using their Blast Router. After I upgrade to the Blast Router, my DVR and set top boxes (STB) could no longer connect. Working with their support team, there was a few things that they thought that it might be because I changed the default IP range away from 192.168.1.0/24. Another thought was that the STBs needed the DHCP turned on as I turned it off. I also run PiHole on my network for DNS and DHCP. Lucky for me I have my PiHole sending its data to Splunk.

After resetting the STBs and Blast Router to factory defaults with the Allo Support team, I went through testing each part of the theories. I changed the default IP range and rebooted the STBs and everything connected. I changed the DNS to PiHole and rebooted the STBs. The STBs did not connect. I changed the DNS back to the internal and everything connected. I changed the DHCP to the PiHole and rebooted the STBs with the DNS pointed to the internal DNS server. After a reboot, the STBs connected with out an issue. I then changed the DNS to point to the PiHole DNS server and rebooted the STBs. They were unable to connect. So the issue is the DNS server in PiHole.

I jumped over to Splunk after grabbing the IPs for the STBs. A quick search of:

index=”pihole” (src=”172.16.24.200″ OR src=”172.16.24.201″ OR src=”172.16.24.202″) answer=NXDOMAIN

showed me that there were some domains that PiHole wasn’t able to resolve.

A quick stats command and I have a list of the domains that the STBs were looking for.

index=”pihole” (src=”172.16.24.200″ OR src=”172.16.24.201″ OR src=”172.16.24.202″) answer=NXDOMAIN
| stats count by query
| sort – count

Now the question is why are they failing and were should they go? Doing a nslookup externally comes back empty and this is why PiHole was failing.

% nslookup pflocal.iptvtg.com 8.8.8.8

Server: 8.8.8.8

Address: 8.8.8.8#53

** server can’t find pflocal.iptvtg.com: NXDOMAIN

I can still ask the Blast Router what it has for DNS for those addresses

% nslookup pflocal.iptvtg.com 172.16.24.1

Server: 172.16.24.1

Address: 172.16.24.1#53

Name: pflocal.iptvtg.com

Address: 10.131.7.82

Now I have two ways I can solve this issue.

  1. I can forward any unknown domains to the Blast Router and it will forward them along
  2. I can get the list of domain requests, do a lookup for them to the Blast Router, and add them as a local DNS entry.

I went for #2. Below are the list of domains that I needed to add to my local DNS:

DomainIP
appstore001.iptvtg.com10.11.154.10
mdspf301.iptvtg.com10.11.150.10
pflocal.iptvtg.com10.131.7.82
time.iptvtg.com10.10.5.100

Connecting Plex and Splunk

I use Plex (https://www.plex.tv/) to be able to play videos at home. Different family members have their own accounts on Plex. I was interested in the viewing habits of the people using my Plex server. If you put Plex in debug mode you can get a lot of logs but I wanted a better way.

I found PlexWatch (https://github.com/ljunkie/plexWatch) on Github. PlexWatch is listed as “Notify and Log watched content on a Plex Media Server”. What made me interested in this project is that you could extend it to connect to external providers (Twitter, Boxcar, Prowl, …). I was hoping I could use this to connect to Splunk’s HEC (HTTP Event Collector).

I was able to also find a Splunk HEC library for Perl on Github. The project is called “Perl Client for Splunk HTTP Event Collector” and at https://github.com/eforbus/perl-splunk-hec.

Requirements:
1. Command line access to a Plex server
2. Splunk instance with HEC enabled
3. Perl installed or ability to have it installed


Below is the step by step I created to connect PlexWatch with Splunk via the HEC. This was done on a CentOS 7 server.

1. Enable the EPEL Release Repo

sudo yum -y –enablerepo=extras install epel-release

2. Add the dependancies

sudo yum -y install perl\(LWP::UserAgent\) perl\(XML::Simple\) perl\(Pod::Usage\) perl\(JSON\) perl\(DBI\) perl-Time-Duration perl-Time-ParseDate perl-DBD-SQLite perl-LWP-Protocol-https perl-Crypt-SSLeay perl-File-ReadBackwards perl-JSON-XS

3. Create the directory for PlexWatch

sudo mkdir /opt/plexWatch/

4. Download the PlexWatch components

sudo wget -P /opt/plexWatch/ https://raw.github.com/ljunkie/plexWatch/master/plexWatch.pl

sudo wget -P /opt/plexWatch/ https://raw.github.com/ljunkie/plexWatch/master/config.pl-dist

3. Create the directory for PlexWatch

sudo mkdir /opt/plexWatch/

5. Set the permissions for the folder and script

sudo chmod 777 /opt/plexWatch && sudo chmod 755 /opt/plexWatch/plexWatch.pl

6. Copy the configuration file from the default to the one used by the script

sudo cp /opt/plexWatch/config.pl-dist /opt/plexWatch/config.pl

7. Edit the configuration file. In the examples I show will be using VIM but in the walk through I show VI. Nano can also be used.

sudo vi /opt/plexWatch/config.pl

7a. Change the $log_client_ip to equal 1 and set the $myPlex_user and $myPlex_pass variables. The $myPlex_user and $myPlex_pass are the credentials to log in to plex.tv.

config.pl section for external ip address and Plex account

7b. Near the end of the configuration file, find the external section. It will look like the below.

config.pl external script area

7c. Add a new section for the Splunk HEC connector.

config.pl script with added section for sending to Splunk

‘Splunk’ => {
‘enabled’ => 1, ## 0 or 1 – set to 1 to enable Splunk script
‘push_watched’ => 1, #stop
‘push_watching’ => 1, #start
‘push_paused’ => 1, #pause
‘push_resumed’ => 1, #resume


‘script_format’ => {
‘start’ => ‘perl /opt/plexWatch/splunk.pl “{user}” “{state}” “{title}” “{streamtype}” “{year}” “{rating}” “{platform}” “{progress}” “{percent_complete}” “{ip_address}” “{length}” “{duration}” “{time_left}”‘,
‘paused’ => ‘perl /opt/plexWatch/splunk.pl “{user}” “{state}” “{title}” “{streamtype}” “{year}” “{rating}” “{platform}” “{progress}” “{percent_complete}” “{ip_address}” “{length}” “{duration}” “{time_left}”‘,
‘resumed’ => ‘perl /opt/plexWatch/splunk.pl “{user}” “{state}” “{title}” “{streamtype}” “{year}” “{rating}” “{platform}” “{progress}” “{percent_complete}” “{ip_address}” “{length}” “{duration}” “{time_left}”‘,
‘stop’ => ‘perl /opt/plexWatch/splunk.pl “{user}” “{state}” “{title}” “{streamtype}” “{year}” “{rating}” “{platform}” “{progress}” “{percent_complete}” “{ip_address}” “{length}” “{duration}” “{time_left}”‘,
},
},

8. Download the Splunk HEC connector library for Perl.

wget https://github.com/eforbus/perl-splunk-hec/archive/master.zip

9. Unzip the the connector

unzip master.zip

10. Copy the libraries to the PlexWatch directory

sudo cp -R ./perl-splunk-hec-master/lib/Splunk /opt/plexWatch/

11. Create and edit the HEC script. This will be what is called from PlexWatch to send the data to the HEC.

sudo vi /opt/plexWatch/splunk.pl

11a. Below is the script. You will need your Splunk server path and HEC token.

splunk.pl Perl script

#!/usr/bin/perl

use lib qw(/opt/plexWatch/);

use Splunk::HEC;

$user=$ARGV[0];
$state=$ARGV[1];
$title=$ARGV[2];
$streamtype=$ARGV[3];
$year=$ARGV[4];
$rating=$ARGV[5];
$platform=$ARGV[6];
$progress=$ARGV[7];
$percent_complete=$ARGV[8];
$ip_address=$ARGV[9];
$show_length=$ARGV[10];
$duration=$ARGV[11];
$time_left=$ARGV[12];

my $hec = Splunk::HEC->new(
url => ‘https://SplunkServer:8088/services/collector/event’,
token => ‘6cc8b5ba-48f3-5c2b-8e9e-9e5e81a0ce57’
);

my $res = $hec->send(event => {user => $user, state => $state, title => $title, streamtype => $streamtype, year => $year, rating => $rating, platform => $platform, progress => $progress, percent_complete => $percent_complete, ip_address => $ip_address, length => $show_length, duration => $duration, time_left => $time_left});

12. Change the abilities of the script to be executable

sudo chmod +x /opt/plexWatch/splunk.pl

13. Test the script. This will send sample data to the Splunk HEC.

/opt/plexWatch/splunk.pl user state title streamtype year rating platform progress percent_complete ip_address length duration time_left

14. Add the PlexWatch script in to the crontab to run on a schedule

sudo crontab -e

14a. Have the script run once per minute

* * * * * /opt/plexWatch/plexWatch.pl

Enjoy the data in Splunk

JSON Data Example
Dashboard Example
Dashboard Example

SpeedCam – Getting the Data

I recently got to be in be on the news for a fun project (see the bottom of the article for the video).  We have had issues with cars speeding down our street.  I have had the traffic department place the street sign that showed your speed down the street.  This did give us some data, but people seeing the signs changed their driving during that drive only.

Being a person that works with data, I thought there has to be a way to track this data source.  I tried to build my own system to track the cars going by.  After trying a few different things, Arduino and Raspberry Pi, I started reading on using a webcams to track cars.

My setup is as followed:
Camera: HIKVision IP Camera (but a USB camera will work also as shown in the news video)
Power Injector: TP-LINK TL-PoE150S
Computer: Dell Laptop running Windows 10
Speed Camera Software: SpeedCam AI
Data Analyst Tool: Splunk

I tried a few different programs and found SpeedCam AI.  This program let me draw a rectangle and define the distance.  I know that the sections of the street are 15 feet (4.572 meters) in length.

I set up two different lanes.  Lane 1 is for West bound traffic and Lane 2 is for East bound traffic.  In the settings you can specify what the delimiter.  You can also use the software to save a picture of the vehicle, and clean up the reports.

With SpeedCam AI writing the details of traffic to a csv file, Splunk can easily ingest the data.

Installing Splunk on Windows
Installing Splunk on Linux

Adding the data to Splunk:
Once you log in to Splunk, you should see an “Add Data” button.

There is a couple options for bringing the data in.  Select “Monitor” to be able to continuously bring in the data.

You will then want to select “Files & Directories”.

Click “Browse” to select your “reports.csv” file and then click “Next”.

You should see a preview of your data.  You will see that Splunk has identified the data in a csv file.  Since the file doesn’t have a header row, you will need to give it one.  In the delimited settings, in the Field names section, click Custom.  In this example I used “datestamp,lane,speed,speedLabel”.  Then click next to continue.

It should prompt you to save your custom sourcetype.  Click Save.

I gave the sourcetype name as “speedcam”.  I then gave it a description and left the category and app the defaults and then click Save.

On the next page we can set the hostname for the data stream. Normally you can leave this the default. In a production environment, we would also want to choose our index. For this example, I am going to leave it as “Default”. At this point we can click “Review”.

You can review the setting and then click Submit and it will start bringing in your data.


For the Command Line People
## inputs.conf ##
[monitor://c:\program files(86)\SpeedCam\reports\reports.csv]
sourcetype = speedcam

## props.conf ##
[speedcam]
INDEXED_EXTRACTIONS = CSV
FIELD_DELIMITER = ,
FIELD_NAMES = datestamp,lane,speed,speedLabel
CHECK_FOR_HEADER = false
SHOULD_LINEMERGE = false


At this point, you have the SpeedCam AI software running and Splunk bringing the data in.  I will follow up with another post on the Splunk App I have written.  In the mean time, here are a few videos on searching and reporting in Splunk.

Basic Searching in Splunk
Creating Reports in Splunk Enterprise
Create Dashboards in Splunk Enterprise

ElectroSmash pedalShield Mega – Part 1

My oldest son has been getting really in to music lately.  He has taught himself guitar, bass, ukulele, piano, and most recently violin.  Having an electrical background, I started to look at the different ways the pedals and guitars are put together.  I started to look at the pedal clones and wanted to do a pedal for my son.  After looking around I saw the pedalShield series.  I like working with Arduinos and Raspberry Pis as you still get to use real components and easily interact with them. The pedalShield Mega looked interesting as it has an LED screen on it to help you see your effects.  I was also interested in being able flash new effects on the pedal as needed.

I have decided to give it a go and have ordered the pedalSHIELD MEGA Kit.  They give you all the schematics and part numbers (minus the LED) to order them yourself from Mouser.  Pricing it out, you do save money ordering the kit directly from ElectroSmash.  The only problem for me is that it is international shipping so a bit of a wait.  I also needed to order the Arduino Mega 2560 board.  That is the brains of the programmable pedal.  My normal go to is Adafruit.  On their site it lists the board as discontinued (link).  After reading a few reviews, I decided to go with a clone board from Amazon.  I went with the Elegoo LYSB01H4ZDYCE-ELECTRNCSMEGA 2560 R3 Board.  While I was on the Amazon site, I felt that to do the job properly I need a new soldering iron, helping hands, and cutter.  The quick math is that I will be doing around 141 solder points for this project.

So far I have spent $108.92 on the project:
$14.86 – Arduino Mega 2560 Clone
$25.85 – Tools
$00.00 – Amazon Prime Shipping
$53.84 – ElectroSmash Kit
$14.37 – Shipping from ElectroSmash

I will still need to get some stand offs to make sure everything is nice and stable when he steps on the pedal and the case enclosure.

I have been going through the forums and looking at the work other have already done with the programming.  I look forward to this project as I haven’t done a project like this in a while.

Geist Watchdog 15, SNMP, and Splunk

I have a few of the Geist Watchdog 15 devices in my data center.  They do a good job monitoring, but getting data out of them isn’t as easy as it could be.  Their latest firmware does introduce JSON over XML.  Unfortunately, there is no way to do API calls to return certain time frames.  You have to download the whole log file.  Geist heavily uses the SNMP method to pull the information.  While this is normally ok, but you do need the custom MIB file for the device which makes it a pain.  I tried multiple ways to have Splunk grab the values from the device, but failed each time.  With a deadline to produce a dashboard (it was 11pm and we had people visiting the office at 8am), I put my Google, Linux, and Splunk skills to a test.

First, let’s install the SNMP tools.

# yum install net-snmp net-snmp-devel net-snmp-utils

Let’s check where the default location of the MIBs are.


# net-snmp-config --default-mibdirs
/root/.snmp/mibs:/usr/share/snmp/mibs

We will want to copy the MIBs to the second location.

# cp /tmp/geist_bb_mib.mib /usr/share/snmp/mibs/geist_bb_mib.mib
(Source location will differ.  The location /tmp/ was where I copied the file to)

Referencing the MIB Worksheet, we can find the OID for the items we want.  In this script I selected: internalName, internalTemp, internalDewPoint, internalHumidity, tempSensorName, tempSensorTemp

Geist does not put the first period for the OID.  In the worksheet they list internalName as 1.3.6.1.4.1.21239.5.1.2.1.3 where the SNMP call would be to .1.3.6.1.4.1.21239.5.1.2.1.3.  We also need to reference the device ID for the OID at the end of the OID.  The base for the Remote Temperature Sensor is .1.3.6.1.4.1.21239.5.1.4.1.3.  To call the first Remote Temperature Sensor I would reference .1.3.6.1.4.1.21239.5.1.4.1.3.1 and the second Sensor is .1.3.6.1.4.1.21239.5.1.4.1.3.2.

To make the call to the device using SNMP, we will be using the snmpget command.

# /usr/bin/snmpget -m all -Ov -v 2c -c public 10.10.10.10 .1.3.6.1.4.1.21239.5.1.4.1.3.1

-m all = Use all of the MIB files
-Ov = Print values only
-v 2c = Use version 2c
-c  public = Use the public snmp string
10.10.10.10 = IP address of the Watchdog 15
.1.3.6.1.4.1.21239.5.1.4.1.3.1 = tempSensorName for Device 1

STRING: ExternalTempSensor1

We are almost there.  Now to clear up the return to only give us the second part of the response.

 # /usr/bin/snmpget -m all -Ov -v 2c -c public 10.10.10.10 .1.3.6.1.4.1.21239.5.1.4.1.3.1 | awk '{print $2}'
 ExternalTempSensor1

Great, now we are getting just the value.  Time to tie the field and value together.  Since the internal name is going to be the same but we are gathering multiple values, I am also adding the _temp so I am able to tell which field I am getting.

InternalName01=`/usr/bin/snmpget -m all -Ov -v 2c -c public 10.10.10.10 .1.3.6.1.4.1.21239.5.1.2.1.3.1 | awk '{print $2}'`
 InternalTemp01=`/usr/bin/snmpget -m all -Ov -v 2c -c public 10.10.10.10 .1.3.6.1.4.1.21239.5.1.2.1.5.1 | awk '{print $2}'`
 Section01=$InternalName01"_temp,"$InternalTemp01
 echo $Section01
 ExternalTempSensor1_temp,871
 

Almost there, now let’s add a date/time stamp.

InternalName01=`/usr/bin/snmpget -m all -Ov -v 2c -c public 10.10.10.10 .1.3.6.1.4.1.21239.5.1.2.1.3.1 | awk '{print $2}'`
 InternalTemp01=`/usr/bin/snmpget -m all -Ov -v 2c -c public 10.10.10.10 .1.3.6.1.4.1.21239.5.1.2.1.5.1 | awk '{print $2}'`
 Section01=$InternalName01"_temp,"$InternalTemp01
 echo -e `date --rfc-3339=seconds`","$Section01
 2016-05-16 22:07:57-05:00,ExternalTempSensor1_temp,871
 

I repeated the section for the different pieces of sensor data I wanted and ended up with a small script.

#!/bin/bash

InternalName01=`/usr/bin/snmpget -m all -Ov -v 2c -c public 10.10.10.10 .1.3.6.1.4.1.21239.5.1.2.1.3.1 | awk '{print $2}'`
 InternalTemp01=`/usr/bin/snmpget -m all -Ov -v 2c -c public 10.10.10.10 .1.3.6.1.4.1.21239.5.1.2.1.5.1 | awk '{print $2}'`
 Section01=$InternalName01"_temp,"$InternalTemp01
 echo -e `date --rfc-3339=seconds`","$Section01

InternalDewPoint01=`/usr/bin/snmpget -m all -Ov -v 2c -c public 10.10.10.10 .1.3.6.1.4.1.21239.5.1.2.1.7.1 | awk '{print $2}'`
 Section02=$InternalName01"_dewpoint,"$InternalDewPoint01
 echo -e `date --rfc-3339=seconds`","$Section02

InternalHumidity01=`/usr/bin/snmpget -m all -Ov -v 2c -c public 10.10.10.10 .1.3.6.1.4.1.21239.5.1.2.1.6.1 | awk '{print $2}'`
 Section03=$InternalName01"_humidity,"$InternalHumidity01
 echo -e `date --rfc-3339=seconds`","$Section03

RemoteName01=`/usr/bin/snmpget -m all -Ov -v 2c -c public 10.10.10.10 .1.3.6.1.4.1.21239.5.1.4.1.3.1 | awk '{print $2}'`
 RemoteTemp01=`/usr/bin/snmpget -m all -Ov -v 2c -c public 10.10.10.10 .1.3.6.1.4.1.21239.5.1.4.1.5.1 | awk '{print $2}'`
 Section04=$RemoteName01"_temp,"$RemoteTemp01
 echo -e `date --rfc-3339=seconds`","$Section04

RemoteName02=`/usr/bin/snmpget -m all -Ov -v 2c -c public 10.10.10.10 .1.3.6.1.4.1.21239.5.1.4.1.3.2 | awk '{print $2}'`
 RemoteTemp02=`/usr/bin/snmpget -m all -Ov -v 2c -c public 10.10.10.10 .1.3.6.1.4.1.21239.5.1.4.1.5.2 | awk '{print $2}'`
 Section05=$RemoteName02"_temp,"$RemoteTemp02
 echo -e `date --rfc-3339=seconds`","$Section05

2016-05-16 22:12:57-05:00,Base_temp,873
 2016-05-16 22:12:57-05:00,Base_dewpoint,620
 2016-05-16 22:12:57-05:00,Base_humidity,43
 2016-05-16 22:12:57-05:00,ExternalSensor1_temp,688
 2016-05-16 22:12:57-05:00,ExternalSensor2_temp,717

I created a folder /opt/scripts/ and /opt/scripts/logs/.  I placed the script in /opt/scripts/ and named it geist.sh.  I set the script to be able to run with:

# chmod +x /opt/scripts/geist.sh

I then add it to the crontab.

# crontab -e

*/1 * * * * /opt/scripts/geist.sh >> /opt/scripts/logs/`date +”%Y%d%m”`_geist.log

You can verify that the script is set to run with:

# crontab -l

*/1 * * * * /opt/scripts/geist.sh >> /opt/scripts/logs/`date +"%Y%d%m"`_geist.log

Now we can log in to Splunk and add the log in to Splunk.  After you log in, go to Settings and then Data inputs.

datainputs

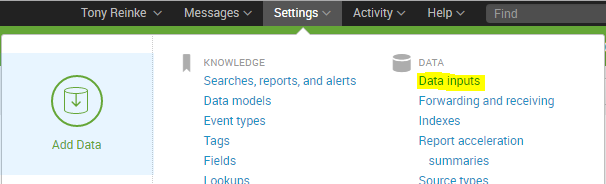
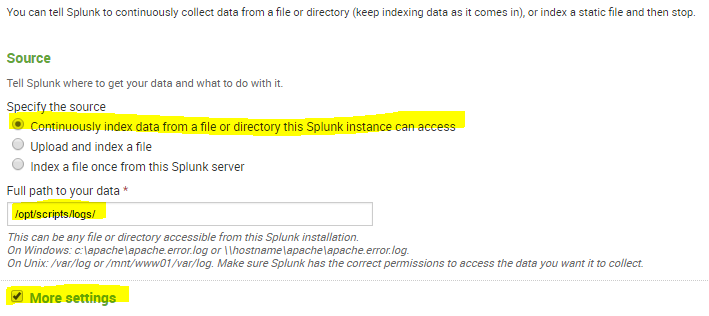
Under the Files & directories, click the Add new link.

addnew

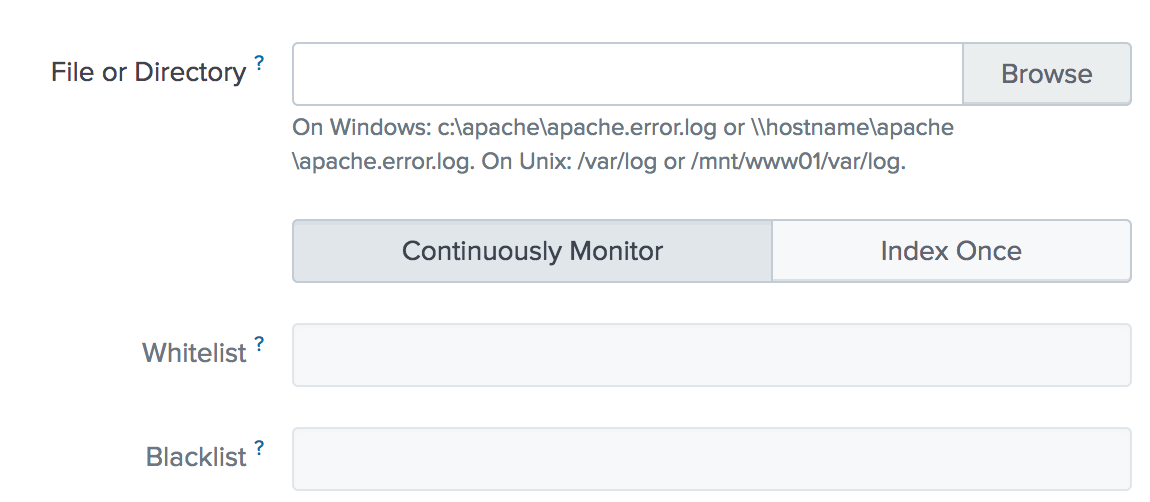
Under the Full path to your data, enter the path to the log file you are writing in the crontab.  Check the box for the More settings option.

adddata1

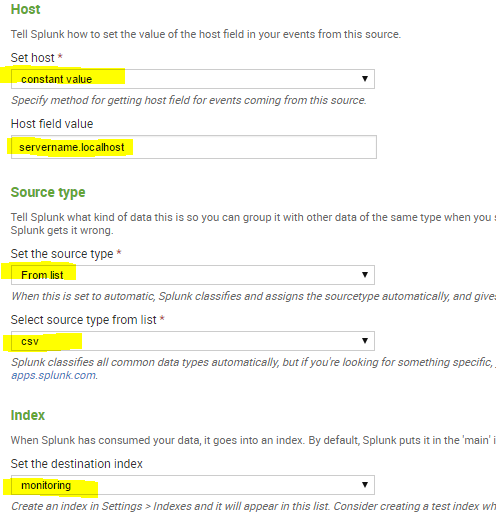
You can set the Host that will be indexed with your data.  In the source type, select From list and then select csv.  You then can select an index for the log files.

adddata2

Now we will set up the field extractions.  You will need to edit the props.conf and transforms.conf files.  If you want to keep this in a certain application, change the file path to $SPLUNK_HOME/etc/apps/{appname}/local/props.conf.

# vi $SPLUNK_HOME/etc/system/local/props.conf
[csv]
 REPORT-Geist = REPORT-Geist

# vi $SPLUNK_HOME/etc/system/local/transforms.conf

[REPORT-Geist]
 DELIMS = ","
 FIELDS = "DateTime","SensorName","SensorValue"

Restart Splunk and you should be able to search you SNMP values.

# $SPLUNK_HOME/bin/splunk restart

The Hacker Manifesto turn 30

The Hacker Manifesto turns 30 today. I remember the first time reading this. I still get goosebumps. I lived the era of the BBS. I was the kid tying up the phone line. I remember the rush of connecting to systems and exploring. Talking to people I didn’t know but I did know them.  We shared knowledge and experience.
 
We were the Keyboard Cowboys, the System’s Samurai, and the Phone Phreaks.

\/\The Conscience of a Hacker/\/

Hacking In Paradise 2013 – Why I want to go

Joseph McCray (@j0emccray) is someone who I have been listening to and watching videos of for a while now.  I first saw him at Defcon.  He is “The only black guy at security conferences”.  With the growth of the security industry, there are “experts” coming out of the wood work.  I had to put experts in quotes because it seems like everyone has an opinion.  There are more certification tags floating around tacked on to peoples names than I can believe.  In this world where everyone has gone through “training”, training to pass a test, it is hard to find the people that truly have a passion and dedication to true security.

So this comes to why I want to go.  For a while part of my job has been in security.  I have written policies to tell people what to do and what not to do.  I have help guide companies in “best practices”.  I have helped people gain access in to systems that they got locked out of.  And I have done more of the old school hacking.  This type of hacking involves taking things a part to see how they work and how they can be made better or defeated.  This is a lot of my daily job as a systems engineer.  Working in the corporate world has taught me that everyone sets things up differently and sometimes you need to reverse engineer how they configured things to know how to make it work.  So why would I want to go?  Because I don’t know enough.  There is so much out there that I don’t know.  Going over the list of topics that are covered strikes a little fear in me.  Topics like Metasploit, Maltego, Nmap, Nikto, IDS, HIDDS, NIDS, SIEM.  I will need a translator just for the names and acronyms.

This type of training is the type I truly enjoy.  You are completely immersed in to the training.  With you being away from work and in an environment with your peers and instructors.  You end of living the training and bouncing the ideas off each other.  While doing some activity, a conversation will strike up about a topic and you send the next hour working through ideas.  In the CyberWar class, you get to attack fully patched newer OS (Windows 7, Server 2008R2, and Linux) with all the intrusion detection tools turned on.  You get to see the logs and alerts that are generated.  You don’t just go and learn about tools, you learn why these tools work and what effect these tools have on the systems.  This is how training should be run!

Hacking In Paradise 2013
http://strategicsec.com/services/training-services/classroom/hacking-in-paradise/

DEFCON 17: Advanced SQL Injection
http://www.youtube.com/watch?v=rdyQoUNeXSg

DEFCON 18: Joseph McCray – You Spent All That Money and You Still Got Own
http://www.youtube.com/watch?v=aYVFBnurpNY

Omaha/Lincoln Splunk User Group – Update

I have stated on two different posts (http://www.anthonyreinke.com/?p=610http://www.anthonyreinke.com/?p=605) about starting a Splunk User Group in the Omaha/Lincoln area.  The first meeting will be on March 12th from 6pm to 9pm at Charlies on the Lake in Omaha.  Register for the event at http://t.co/syA5AFTO7U.

VENUECharlies on the Lake
4150 South 144th Street
Omaha, NE 68137
Website | DirectionsWHENTuesday, March 12th
6:00pm – 9:00pmAGENDA

  • What’s New in Splunk 5.0? Presentations by Splunk SEs
  • Open Forum

Splunk RSS Splunk Facebook Splunk Twitter Splunk LinkedIn

Hi There,Don’t forget to register for the Splunk User Group in Omaha on March 12th! We’ll get together to share ideas and learn from one other.Whether you are getting started, creating intelligent searches and alerts or building complex dashboards, this group is for you. Meet other Splunk users and get tips you need to be more successful.Click here to register. There is limited availability, so register today to secure your spot. Expect lots of discussion, snacks, drinks and, of course, t-shirts!

For any questions about this meeting, feel free to contact:
Mike Mizener
[email protected]
402.916.1803

We look forward to seeing you!

The Splunk Team and Continuum


Splunk and the engine for machine data are registered trademarks or trademarks of Splunk Inc., and/or its subsidiaries and/or affiliates in the United States and/or other jurisdictions. All other brand names, product names or trademarks belong to their respective holders.  © 2013 Splunk Inc. All rights reserved.

To unsubscribe from future emails or to update your e-mail preferences click here.
To forward this email to a friend, click here.

Splunk Inc. | 250 Brannan St. | San Francisco, CA 94107


My first non tutorial Arduino project

I have been playing with the Arduino Uno board and after going through a bunch of tutorials, I wanted to branch out and do my own.  I have the Ultrasonic Module HC-SR04 and a standard piezoelectric buzzer.  On the ultrasonic module, VCC goes to digital pin 2.  Trig goes to digital pin 3.  Echo goes to digital pin 4.  GND goes to the ground rail which connects to GND pin on the arduino.  On the buzzer, the positive lead goes to pin 11 and the negitive pin goes to the ground rail which is connected to the GND pin on the arduino.    Below is the code:


void setup() {
 pinMode (122,OUTPUT);//attach pin 2 to vcc
 pinMode (5,OUTPUT);//attach pin 5 to GND
 // initialize serial communication:
 Serial.begin(9600);
 pinMode(11, OUTPUT); // sets the pin of the buzzer as output
}
void loop()
{
digitalWrite(122, HIGH);
 // establish variables for duration of the ping,
 // and the distance result in inches and centimeters:
 long duration, inches, cm;
// The PING))) is triggered by a HIGH pulse of 2 or more microseconds.
 // Give a short LOW pulse beforehand to ensure a clean HIGH pulse:
 pinMode(3, OUTPUT);// attach pin 3 to Trig
 digitalWrite(3, LOW);
 delayMicroseconds(122);
 digitalWrite(3, HIGH);
 delayMicroseconds(5);
 digitalWrite(3, LOW);
// The same pin is used to read the signal from the PING))): a HIGH
 // pulse whose duration is the time (in microseconds) from the sending
 // of the ping to the reception of its echo off of an object.
 pinMode (4, INPUT);//attach pin 4 to Echo
 duration = pulseIn(4, HIGH);
// convert the time into a distance
 inches = microsecondsToInches(duration);
 cm = microsecondsToCentimeters(duration);

 Serial.print(inches);
 Serial.print("in, ");
 Serial.print(cm);
 Serial.print("cm");
 Serial.println();

 if (cm < 50) {
 analogWrite(11,128);
 } 
 else {
 digitalWrite(11, LOW);
 }

 delay(100);
}
long microsecondsToInches(long microseconds)
{
 // According to Parallax's datasheet for the PING))), there are
 // 73.746 microseconds per inch (i.e. sound travels at 1130 feet per
 // second). This gives the distance travelled by the ping, outbound
 // and return, so we divide by 2 to get the distance of the obstacle.
 // See: http://www.parallax.com/dl/docs/prod/acc/28015-PING-v1.3.pdf
 return microseconds / 74 / 2;
}
long microsecondsToCentimeters(long microseconds)
{
 // The speed of sound is 340 m/s or 29 microseconds per centimeter.
 // The ping travels out and back, so to find the distance of the
 // object we take half of the distance travelled.
 return microseconds / 29 / 2;
}