I recently upgrade my Allo wireless to using their Blast Router. After I upgrade to the Blast Router, my DVR and set top boxes (STB) could no longer connect. Working with their support team, there was a few things that they thought that it might be because I changed the default IP range away from 192.168.1.0/24. Another thought was that the STBs needed the DHCP turned on as I turned it off. I also run PiHole on my network for DNS and DHCP. Lucky for me I have my PiHole sending its data to Splunk.
After resetting the STBs and Blast Router to factory defaults with the Allo Support team, I went through testing each part of the theories. I changed the default IP range and rebooted the STBs and everything connected. I changed the DNS to PiHole and rebooted the STBs. The STBs did not connect. I changed the DNS back to the internal and everything connected. I changed the DHCP to the PiHole and rebooted the STBs with the DNS pointed to the internal DNS server. After a reboot, the STBs connected with out an issue. I then changed the DNS to point to the PiHole DNS server and rebooted the STBs. They were unable to connect. So the issue is the DNS server in PiHole.
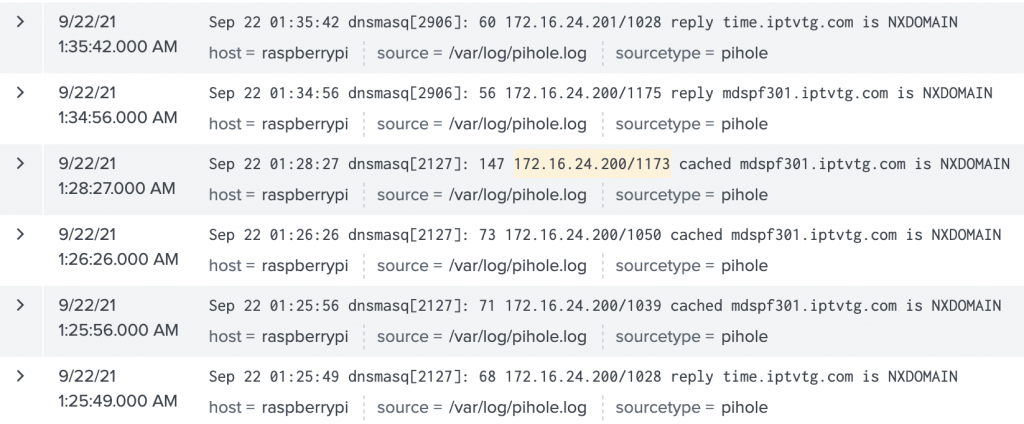
I jumped over to Splunk after grabbing the IPs for the STBs. A quick search of:
index=”pihole” (src=”172.16.24.200″ OR src=”172.16.24.201″ OR src=”172.16.24.202″) answer=NXDOMAIN
showed me that there were some domains that PiHole wasn’t able to resolve.
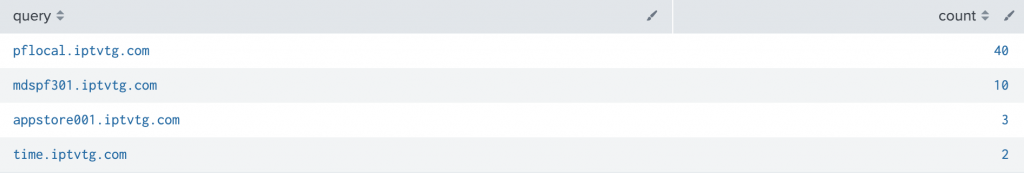
A quick stats command and I have a list of the domains that the STBs were looking for.
index=”pihole” (src=”172.16.24.200″ OR src=”172.16.24.201″ OR src=”172.16.24.202″) answer=NXDOMAIN | stats count by query | sort – count
Now the question is why are they failing and were should they go? Doing a nslookup externally comes back empty and this is why PiHole was failing.
% nslookup pflocal.iptvtg.com 8.8.8.8
Server: 8.8.8.8
Address: 8.8.8.8#53
** server can’t find pflocal.iptvtg.com: NXDOMAIN
I can still ask the Blast Router what it has for DNS for those addresses
% nslookup pflocal.iptvtg.com 172.16.24.1
Server: 172.16.24.1
Address: 172.16.24.1#53
Name: pflocal.iptvtg.com
Address: 10.131.7.82
Now I have two ways I can solve this issue.
I can forward any unknown domains to the Blast Router and it will forward them along
I can get the list of domain requests, do a lookup for them to the Blast Router, and add them as a local DNS entry.
I went for #2. Below are the list of domains that I needed to add to my local DNS:
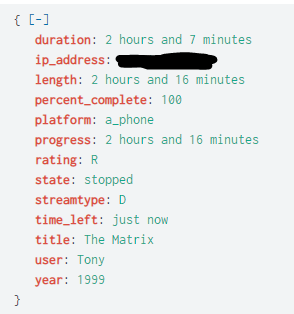
I use Plex (https://www.plex.tv/) to be able to play videos at home. Different family members have their own accounts on Plex. I was interested in the viewing habits of the people using my Plex server. If you put Plex in debug mode you can get a lot of logs but I wanted a better way.
I found PlexWatch (https://github.com/ljunkie/plexWatch) on Github. PlexWatch is listed as “Notify and Log watched content on a Plex Media Server”. What made me interested in this project is that you could extend it to connect to external providers (Twitter, Boxcar, Prowl, …). I was hoping I could use this to connect to Splunk’s HEC (HTTP Event Collector).
I was able to also find a Splunk HEC library for Perl on Github. The project is called “Perl Client for Splunk HTTP Event Collector” and at https://github.com/eforbus/perl-splunk-hec.
Requirements: 1. Command line access to a Plex server 2. Splunk instance with HEC enabled 3. Perl installed or ability to have it installed
Below is the step by step I created to connect PlexWatch with Splunk via the HEC. This was done on a CentOS 7 server.
7. Edit the configuration file. In the examples I show will be using VIM but in the walk through I show VI. Nano can also be used.
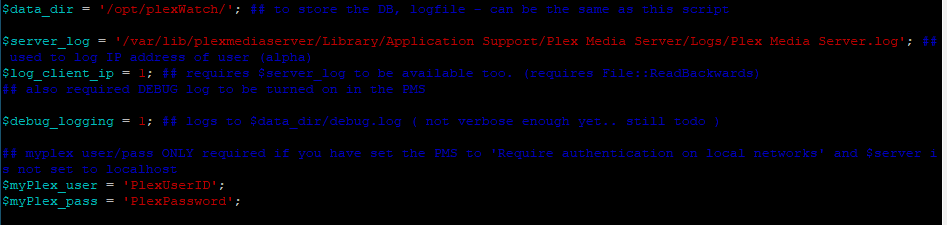
sudo vi /opt/plexWatch/config.pl
7a. Change the $log_client_ip to equal 1 and set the $myPlex_user and $myPlex_pass variables. The $myPlex_user and $myPlex_pass are the credentials to log in to plex.tv.
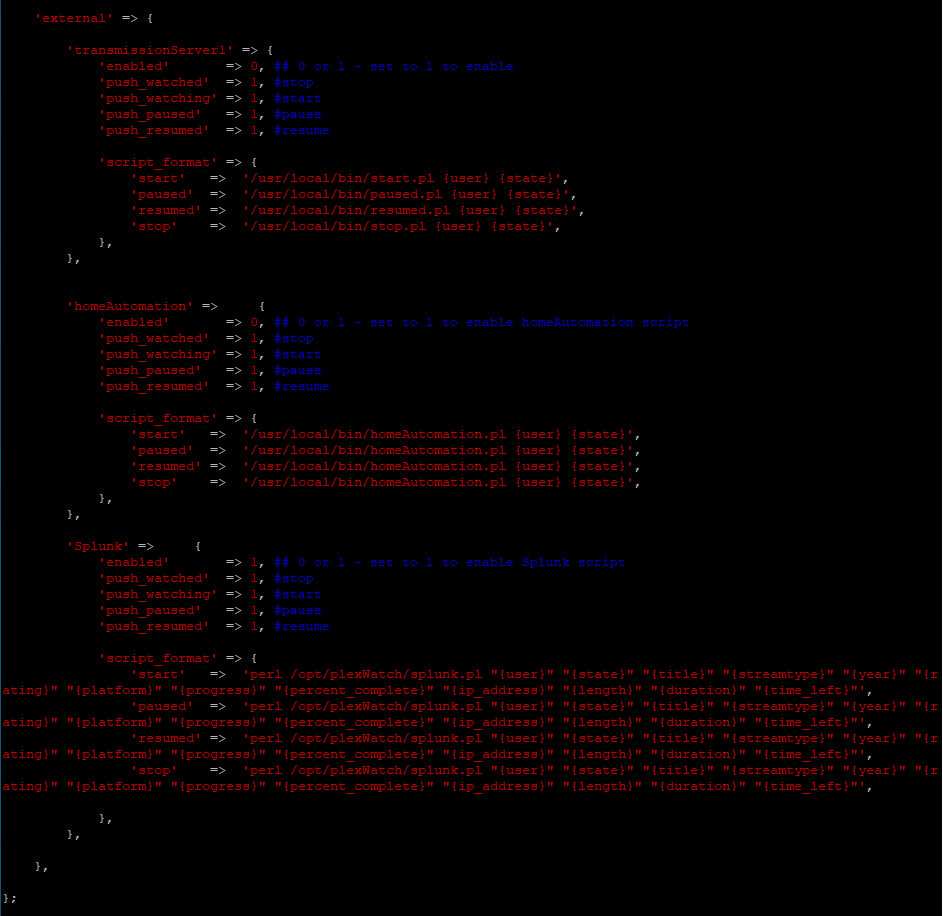
7b. Near the end of the configuration file, find the external section. It will look like the below.
7c. Add a new section for the Splunk HEC connector.
‘Splunk’ => {
‘enabled’ => 1, ## 0 or 1 – set to 1 to enable Splunk script ‘push_watched’ => 1, #stop
‘push_watching’ => 1, #start
‘push_paused’ => 1, #pause
‘push_resumed’ => 1, #resume
I recently got to be in be on the news for a fun project (see the bottom of the article for the video). We have had issues with cars speeding down our street. I have had the traffic department place the street sign that showed your speed down the street. This did give us some data, but people seeing the signs changed their driving during that drive only.
Being a person that works with data, I thought there has to be a way to track this data source. I tried to build my own system to track the cars going by. After trying a few different things, Arduino and Raspberry Pi, I started reading on using a webcams to track cars.
My setup is as followed:
Camera: HIKVision IP Camera (but a USB camera will work also as shown in the news video)
Power Injector: TP-LINK TL-PoE150S
Computer: Dell Laptop running Windows 10
Speed Camera Software: SpeedCam AI
Data Analyst Tool: Splunk
I tried a few different programs and found SpeedCam AI. This program let me draw a rectangle and define the distance. I know that the sections of the street are 15 feet (4.572 meters) in length.
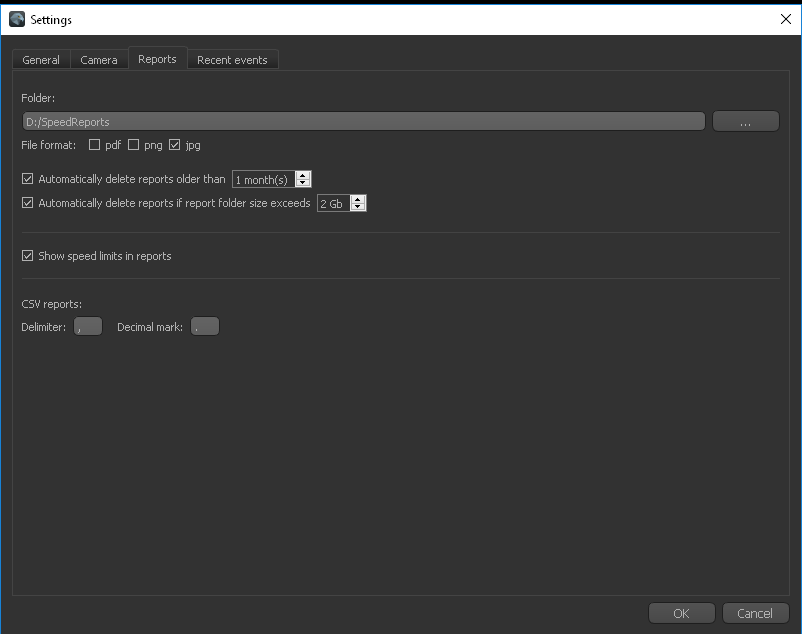
I set up two different lanes. Lane 1 is for West bound traffic and Lane 2 is for East bound traffic. In the settings you can specify what the delimiter. You can also use the software to save a picture of the vehicle, and clean up the reports.
With SpeedCam AI writing the details of traffic to a csv file, Splunk can easily ingest the data.
Adding the data to Splunk:
Once you log in to Splunk, you should see an “Add Data” button.
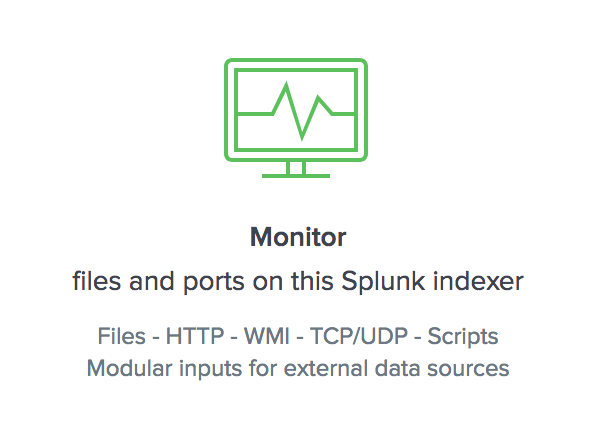
There is a couple options for bringing the data in. Select “Monitor” to be able to continuously bring in the data.
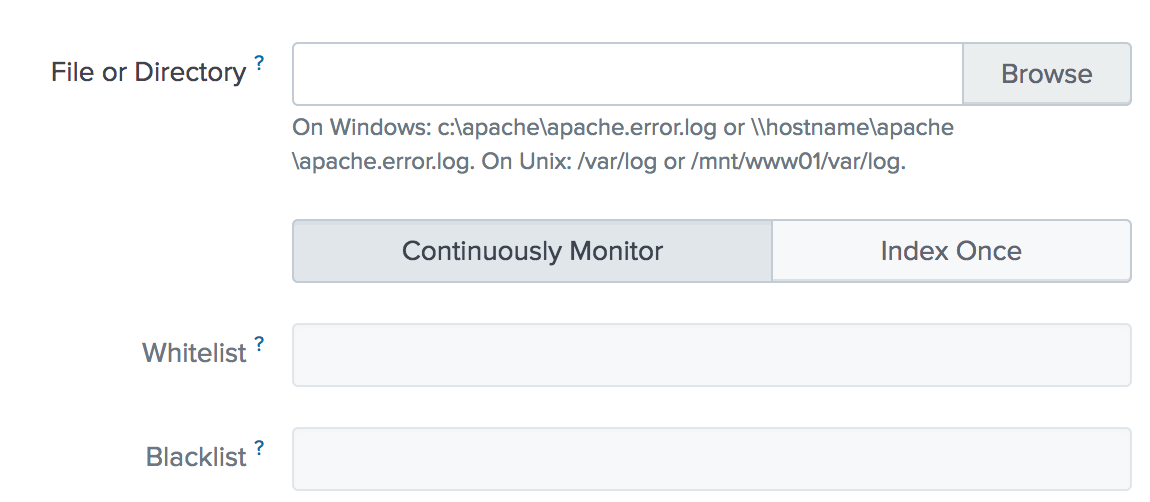
You will then want to select “Files & Directories”.
Click “Browse” to select your “reports.csv” file and then click “Next”.
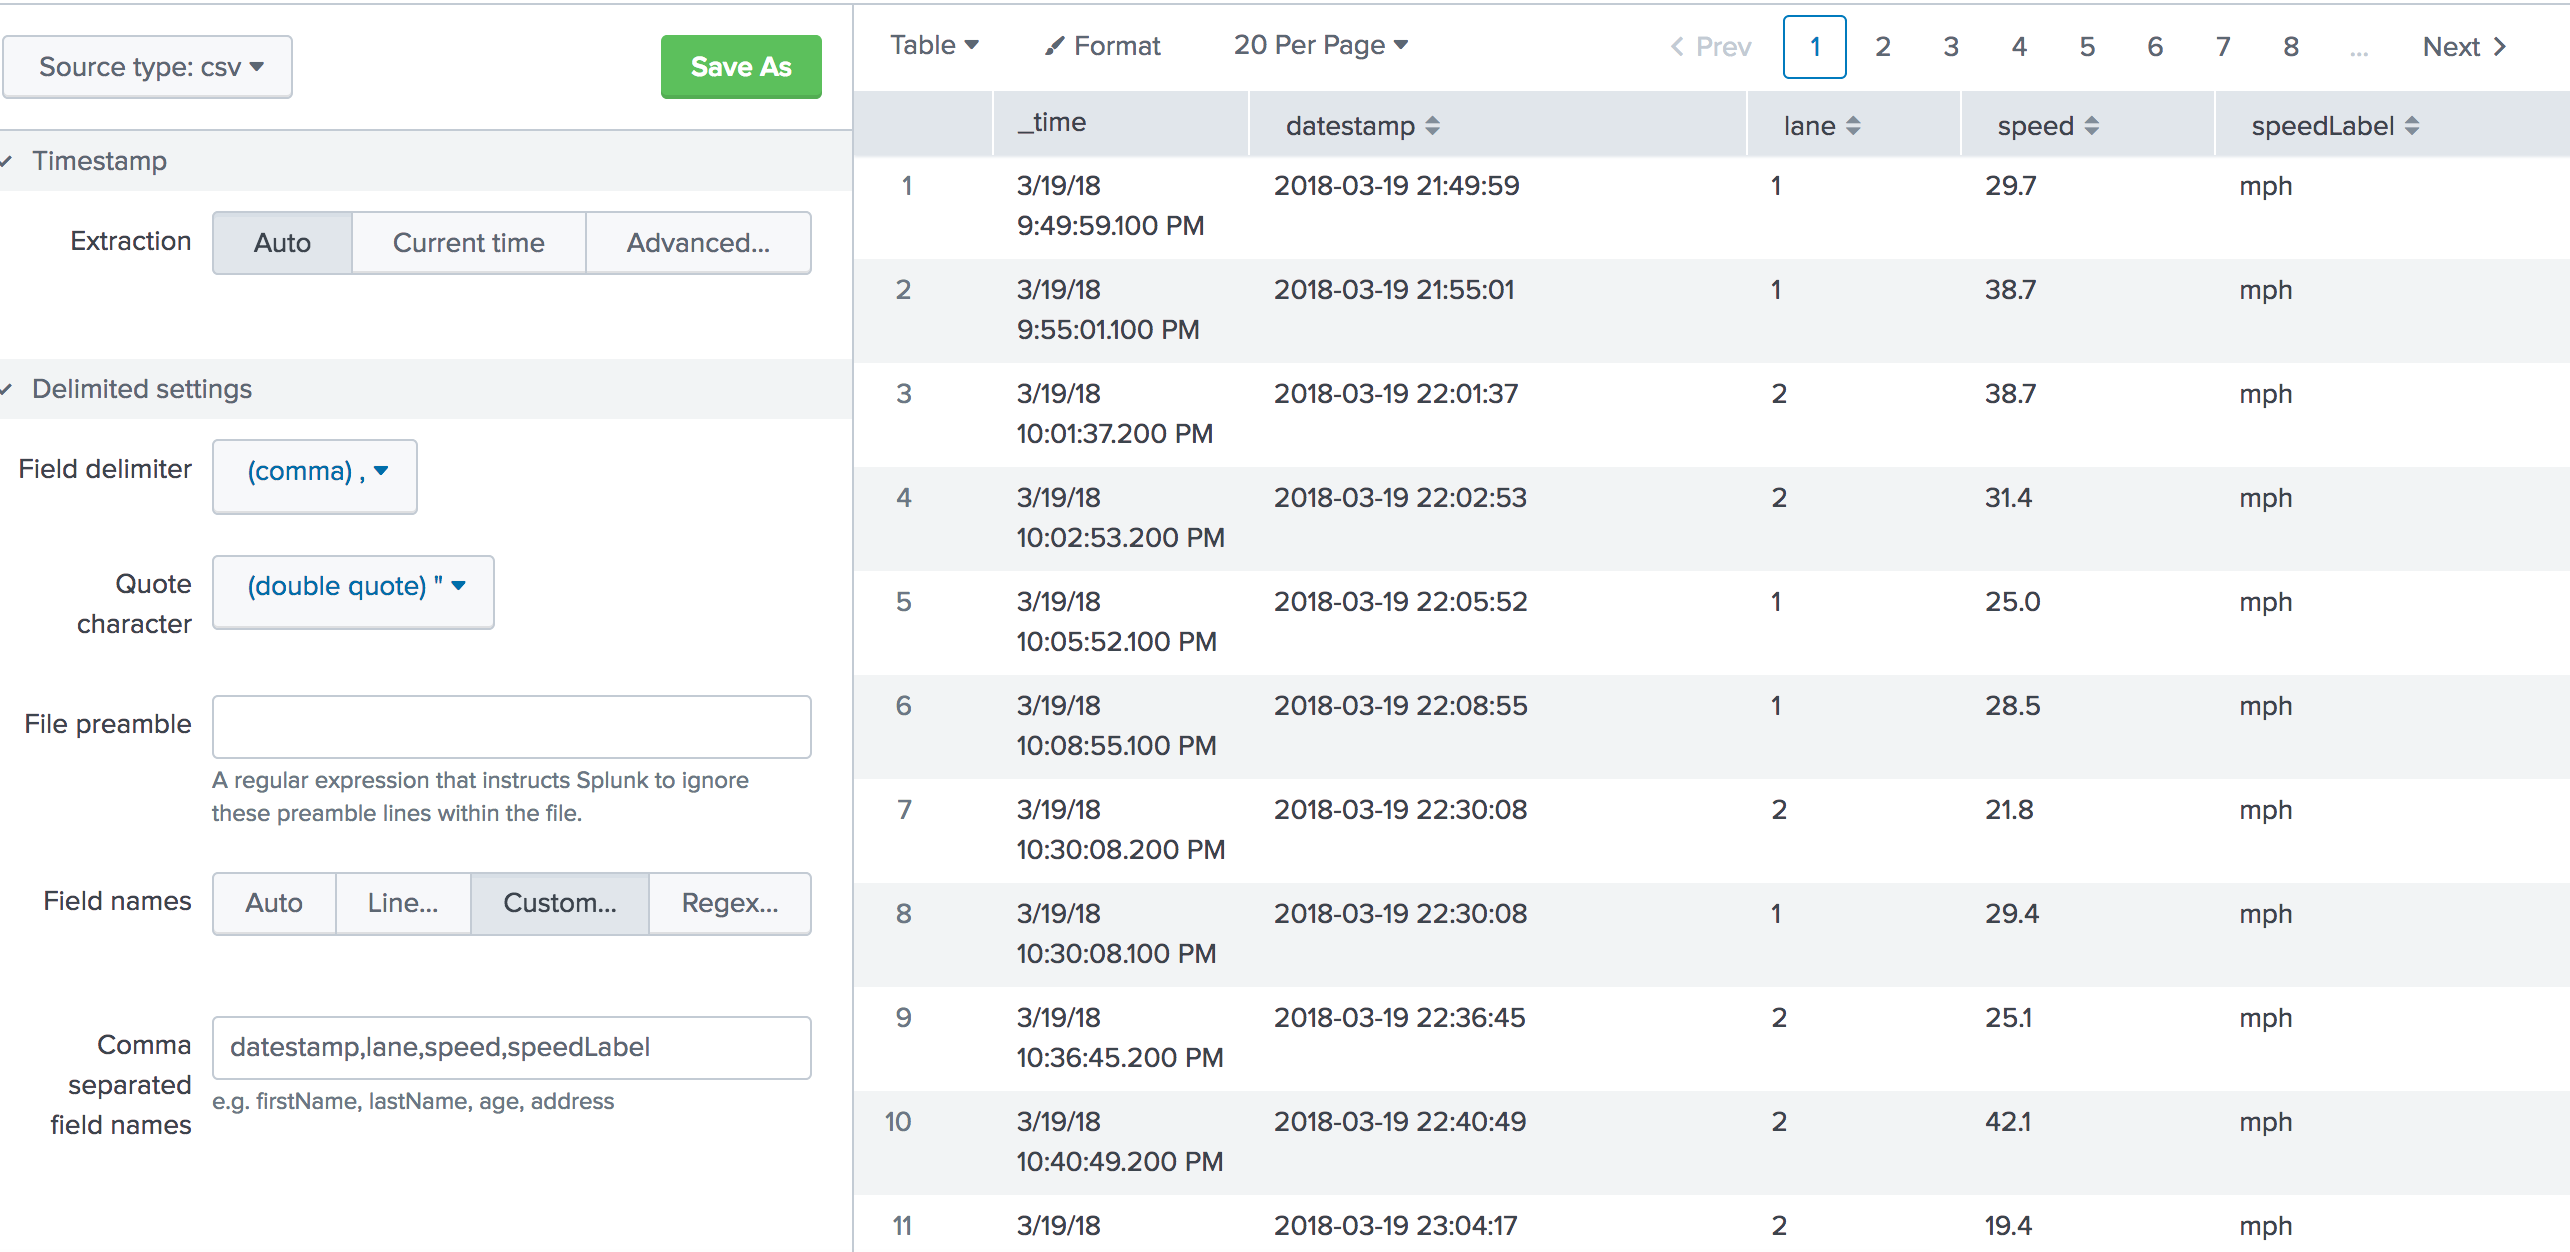
You should see a preview of your data. You will see that Splunk has identified the data in a csv file. Since the file doesn’t have a header row, you will need to give it one. In the delimited settings, in the Field names section, click Custom. In this example I used “datestamp,lane,speed,speedLabel”. Then click next to continue.
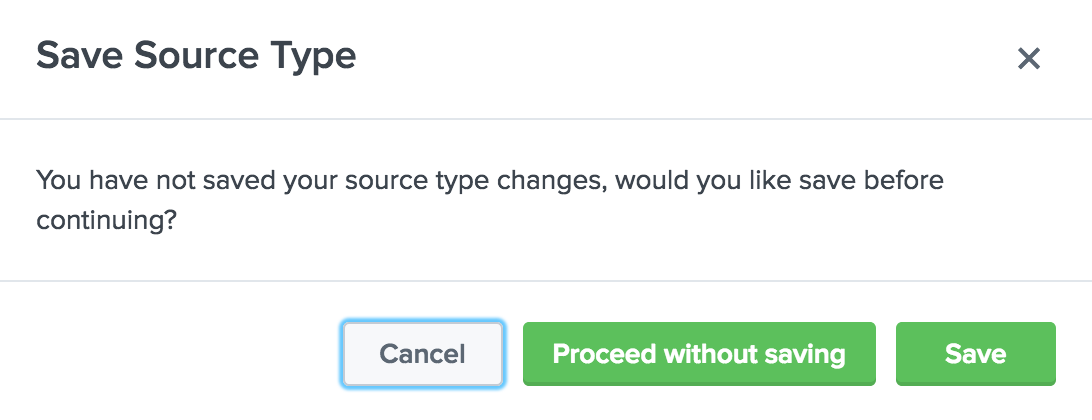
It should prompt you to save your custom sourcetype. Click Save.
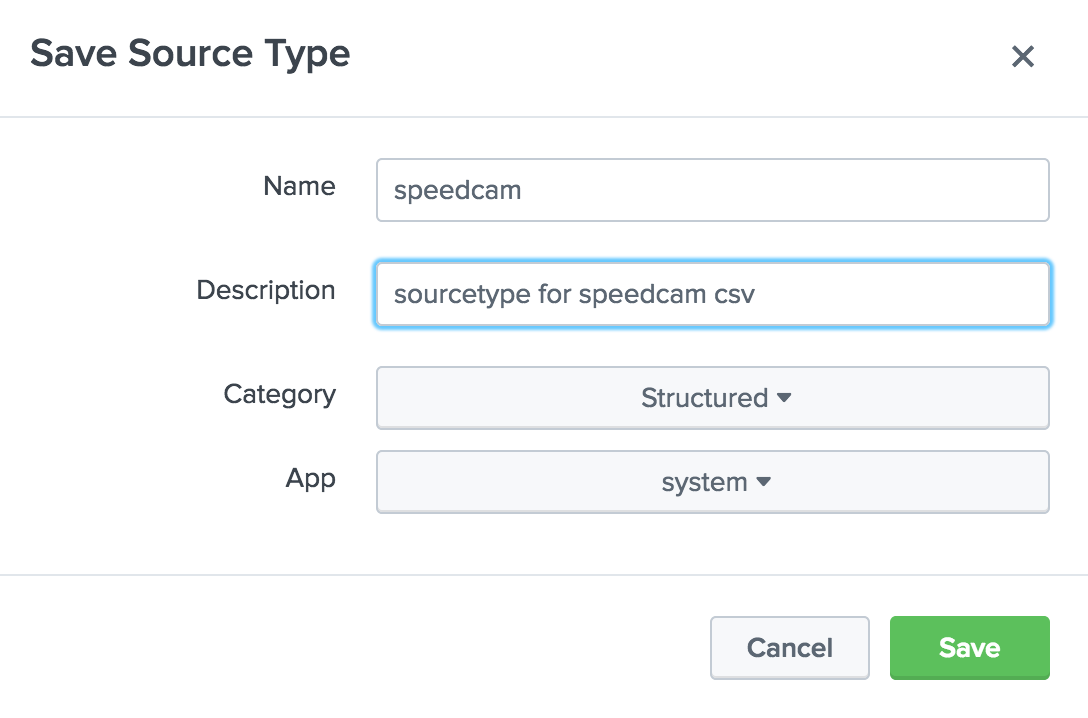
I gave the sourcetype name as “speedcam”. I then gave it a description and left the category and app the defaults and then click Save.
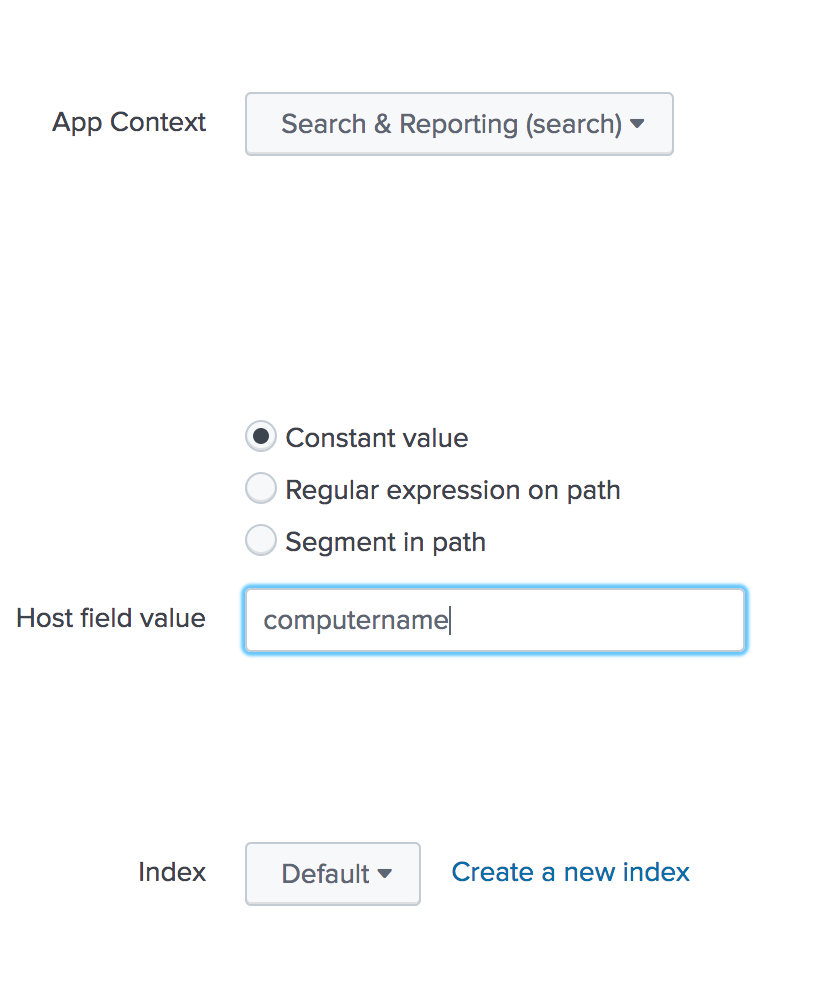
On the next page we can set the hostname for the data stream. Normally you can leave this the default. In a production environment, we would also want to choose our index. For this example, I am going to leave it as “Default”. At this point we can click “Review”.
You can review the setting and then click Submit and it will start bringing in your data.
For the Command Line People ## inputs.conf ## [monitor://c:\program files(86)\SpeedCam\reports\reports.csv]
sourcetype = speedcam
At this point, you have the SpeedCam AI software running and Splunk bringing the data in. I will follow up with another post on the Splunk App I have written. In the mean time, here are a few videos on searching and reporting in Splunk.